
See Fibonacci magic in Dhaka Stock Exchanges

 Fibonacci trading is a mysterious thing to novice TA followers. But all over the world experieced and professional traders have been using these retracements for years to help identify price sup-port and resistance. For months I have observe that it is very much effective in Dhaka Stock Exchanges (DSE) stocks. But as TA is not practiced here widely, nobody talk about Magic of Fibonacci. Today i just randomly selected three of my favorite stocks and Fibonacci proved again its magic.

Formula is not so complex. Major trend has two points : 100 and 0 and here its two dashed lines at top and bottom. At middle are fibonacci points lines.
They are generally, 0.382; 0.5; 0.618; 0.786; 1.618; 2.618.


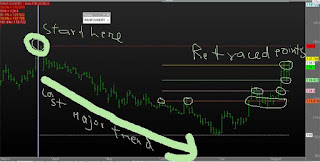
In Ranfoundry we can see how price misteriusly went up and down in line with the fibonacci points.
Pictures follows: (Agni, Aims, Alhaj and Altex)


Comments

Popular posts from this blog

Trading System : Using KPL with MIDAS curve

Firsly, the KPL Swing is a simple trend following mechanical trading system. It automates the entry and exit signal. This trading system is very simple and easy to use. It works across multiple time frames and does not require any in-depth knowledge of TA. In KPL System no targets are given as no one knows how high (or low) the stock price will reach. A trailing stoploss locks in the gains and removes emotions from trading. Secondly, the the MIDAS System. The MIDAS system of technical market analysis is based on the concept of Volume Weighted Average Price (VWAP). VWAP calculations is being used widely worldwide. A standard VWAP calculation represents the total value of shares traded in a particular stock on a particula  day divided by the total volume of shares traded in that stock on that day. Here i`m giving a chart using bothe KPL and MIDAS (three lines) curves. As example, BERGER symbol (data updated at 4 Aug, 2010) has been used. In chart its visible that both ...

Make your Amibroker Chart Colorful

You can make any chart of Amibroker Colorful with gradient effect. Just copy and paste this code above any afl codes, save, open parameter and choice two of your favorite color. Its done! code are : SetChartBkGradientFill( ParamColor("BgTop", ColorRGB( 172,172,172 )), ParamColor("BgBottom", ColorRGB( 172,172,172 )),ParamColor("titleblock",ColorRGB( 172,172,172 ))); This tip is not intended for primary level user. To change Amibroker`s default Background color visit http://tatunnel.blogspot.com/2010/07/change-amibroker-chart-background-color.html